Many people helped bring this study to fruition. First, we
want to express our appreciation to several people at Tabor College for their
help with this project. President David Janzen reviewed the prospectus and
encouraged us to undertake the study. Executive Vice President of Academics and
Compliance, Frank Johnson, wrote a letter of introduction and support to the
Class of ’67. Vice President of Philanthropy, Ron Braun, and Rod Hamm,
Director of Alumni Relations, helped us track down classmates and cross-check
email addresses. Jim Paulus, Assistant professor of Psychology and Chair of the
Tabor Institutional Review Board, facilitated the review and approval of the
research methodology and questionnaire by that group. Thank you all so much!
We also want to thank several faculty colleagues from other
universities who reviewed the survey instrument and suggested changes that
improved it: Duane Stoltzfus (Communications; Goshen College), Lindsey Ibanez
(Sociology; Washburn University), Doug Penner (Former President; Bethel
College, KS), Mike Yoder (Sociology; Northwestern College, IA), and Norm Ewert
(Economics; Wheaton College, IL). Their comments and suggestions helped us
sharpen the questions and refine the instrument.
We asked several people who graduated from Tabor just before
or after we did to complete the questionnaire as a pre-test and share their
comments, suggestions, and observations with us. Based on the suggestions from
those who took the pre-test, we made a number of modifications. We promised
them anonymity and so we can’t thank them by name here, but we’re
grateful for their help!
Wayne Steffen polished the report and made it more coherent
and readable. Thanks, Wayne! The four of us, however, are responsible for any
errors in the data, analysis, or presentation.
This project would not have been possible without the
understanding, love, and support of Anita, Ginger, Ruth, and Priscilla! Zoom
calls frequently ran late. Lunches were delayed. Other projects and outings
were placed on hold because we were so involved with this study. Thank for your
patience and understanding, as well as for those occasional—and needed—reminders
that our combined male perspective might have missed something!
This report is based on a
research project that grew out of conversations among the four of us who
graduated from Tabor College in 1967. We all worked in Africa, went to graduate
school, and then spent most of our careers in higher education, where
conducting research and publishing the findings became part of our professional
lives. Over the decades, we talked with each other and exchanged emails. We
reflected on our Tabor experience and noted the ways through which it
influenced the trajectory of our lives and professions. We also wondered how
our classmates viewed their college experience 50+ years later and how
attending Tabor affected their lives and careers. We decided to ask them.
We discussed at length who
should be considered a “classmate.” We ended up with a list that
included all who graduated with us in 1967, those who began with us but
graduated from Tabor a year earlier or later than we did, and those who spent
at least two years as “one of us.” We ended up with 50 respondents
out of the 74 living classmates from 1967. As members of this class, the four
of us also completed the questionnaire. See Appendix I for more details about
the methodology used in the study.
Every research project has
certain limitations. So does ours. However, a response rate of 68% is very high
for social science research. There are things we’d do differently next
time but we’re confident that the data generally represent the Class of
’67.
We want to express our deep
thanks to all of you who completed your questionnaires. We hope you will find
the results as interesting as we did! We also hope that what we learned will be
helpful to Tabor College and others interested in Christian higher education.
back to table of contents
We begin our review of the data
by examining the background characteristics of our class. Figure
1‑1 shows the states or countries in which those who responded to the
survey were born:
Figure
1‑1 The places where members of the Class of '67 were born.
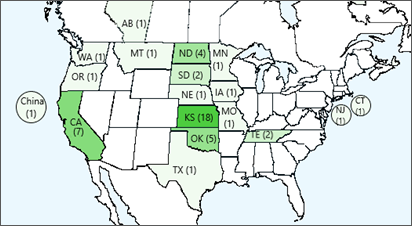
Thirty-five percent of us came
from Kansas, where Tabor College is located.
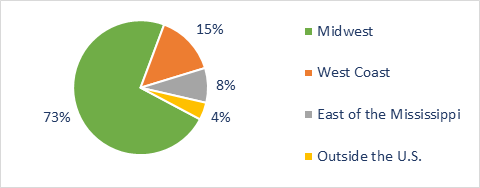
Figure
1‑2 shows that three-quarters came from the Midwest (defined here as the
region between the Mississippi River and the Rockies). Only 4% were born
outside the United States.
Figure 1‑2 The regions from which we came.
There was nearly an even split
between the number of men and women in our class as Figure 1‑3 shows:
Figure 1‑3 The composition of our class by gender.
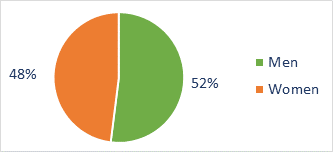
Of the 50 respondents in our survey, 26 were men and 24 were
women. That apparent 52%-48% balance contrasts with the fact that nationally,
50 years ago, 58% of college students in the U.S. were men. But the percentages
among our respondents are distorted by a startling reality that affected our
pool of available respondents: over the past half century 26 of our classmates
have died—22 of them men, and four women. A count of pictures in Tabor Bluejay yearbooks
showed that our freshman class had 61 men and 48 women (56% male). Our senior
class had 37 men and 31 women (55%). Both of those figures are closer to the
national average at the time.
We asked respondents where they
lived at age 16. Figure 1‑4 reflects the small, rural communities from
which we came:
Figure 1‑4 The types of places in which we lived at age 16.
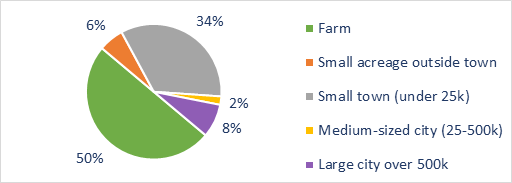
Half of us grew up on farms,
several on small acreages, and another third in small towns. Only a few came
from medium or large cities.
We wanted to know whether our
classmates attended Christian high schools, graduated from public schools, or
were home-schooled. Figure 1‑5 shows what we learned:
Figure 1‑5 The type of high schools from which we graduated.
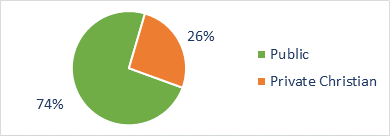
Three-quarters attended public
high schools, but a significant proportion graduated from private Christian academies.
None reported being home schooled.
Most of us came from very small
high schools as the following graphic shows:
Figure
1‑6 The number of students in our high school graduating classes.
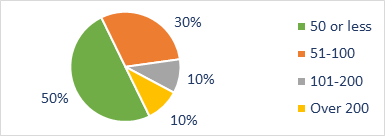
Only 20% of us were part of
graduating classes larger than 100 students. This reflects the small towns and
rural communities from which we came.
From high school to college
Figure 1‑7 The percentage of us going straight from high school to college.
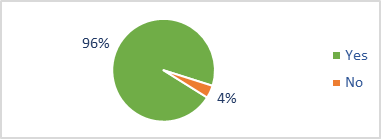
With nearly all of us going
directly from high school to college, we were clearly young and had little life
experience. Going to Tabor was our first step toward becoming independent
adults.
Tabor College was the U.S.
Mennonite Brethren Church’s only four-year college as we were completing
high school. (Fresno Pacific University, Tabor’s sister school, started
its four-year program in 1963 and was accredited as a four-year college in
1965, a year after Tabor.)
Figure 1‑8 shows that
two-thirds of us grew up in Mennonite Brethren (MB) congregations, increasing
the likelihood that we would enroll at Tabor:
Figure 1‑8 The churches we attended during our
senior year of high school.
No one reported coming from the
other options that we provided: Pentecostal,
Catholic, Not
part of a church… or Other religions.
The majority of us came from Mennonite backgrounds, but we will see later that
our denominational affiliations changed over the years.
back to table of contents
We asked several questions about
the families in which we were raised. We were interested in the educational
levels of our parents as well as how well off we perceived our families to be
as we grew up.
Since the educational level of parents is generally seen as
one factor influencing the education aspirations of their children, we included
this in our study. The distribution is portrayed in Figure
2‑1.
Figure 2‑1 Our parents' education levels.
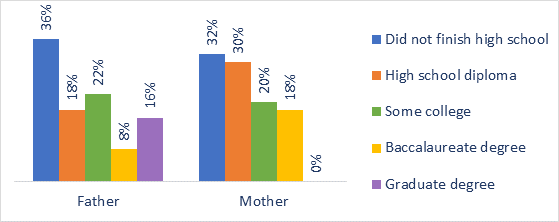
Around a third of both mothers and fathers did not finish
high school. However, there is a wider distribution of educational levels
among fathers than mothers. Eighteen percent of our mothers earned a
baccalaureate degree, but none of them obtained graduate degrees. A quarter
of our fathers received at least a baccalaureate degree, and more than
half of those fathers went on to earn a graduate degree.
Further investigation showed
that nearly a quarter of us came from homes where neither parent had
finished high school. For 64% of us, neither parent finished college.
A family’s financial well-being often influences the educational
opportunities of the children. It would be difficult for anyone to objectively
evaluate the actual economic situation of their family five decades later. We
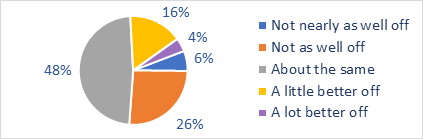
did, however, ask people how they perceived their families’
financial well-being compared to other families in their community as they were
growing up. The results are shown in Figure
2‑2.
Figure 2‑2
How well-off we perceived our families to be compared to other families.
Most of us came from farms or
small towns that tend to be economically more homogeneous than large urban
centers. It’s not surprising that we generally saw our families in the
same economic situation as others in our communities. Forty-eight percent said
their families’ financial situation was “about the same” as
others while only 10% felt their families were a little or a lot better off
than others in their communities. More than a quarter, however, felt their
families were worse off financially than others around them.
The data show that classmates
didn’t have to feel better off than others in their community in order to
go to college. Further analysis showed that the perception of wealth had no
effect on educational achievement.
When we compared the perceptions
of men and women about their families’ financial well-being as they were
growing up, we found some minor differences as shown in Figure
2‑3.
Figure 2‑3
Differences in how the men and women perceived their families' financial
well-being.
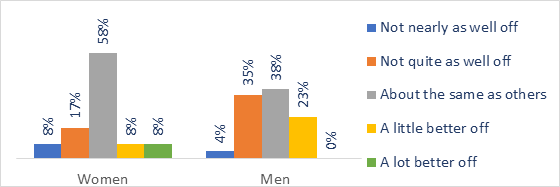
The majority of women felt their families were financially
the same as others in their communities. Only 38% of the men perceived their
families’ situations as comparable to others, while 39% felt theirs were
less well off than others.
back to table of contents
We noted earlier that nearly all of
us went directly from high school to college. We also wanted to know the
reasons for that decision, why we chose Tabor, and how we experienced Tabor.
We asked our classmates to
explain, in their own words, the reasons for deciding to go to college. The
common theme running through their responses was that their families had
encouraged higher education and created the assumption that college was the
natural, next step after high school. Some of the comments included: "My
parents expected me to go to college." "All my friends
my age were going to college, and my family supported it." "It was
the normal thing to do." This is particularly significant
because more than half of our parents never attended college themselves.
Many saw going to college as "the
key to a good paying job." College would open up career options or
provide a gateway to a particular career. Some saw it as "a way to
escape the farm" or "to stay out of military service."
We wanted to know why our classmates chose to attend Tabor,
so based on our experience in higher education, we identified ten possible reasons
for choosing a college. People do things for multiple reasons, so we asked our
classmates to select the three top reasons for having selected Tabor as
their undergraduate institution. In the following chart we compared how men and
women responded to this question:
Figure 3‑1
Our reasons for choosing Tabor. (Each respondent could select up to three.)
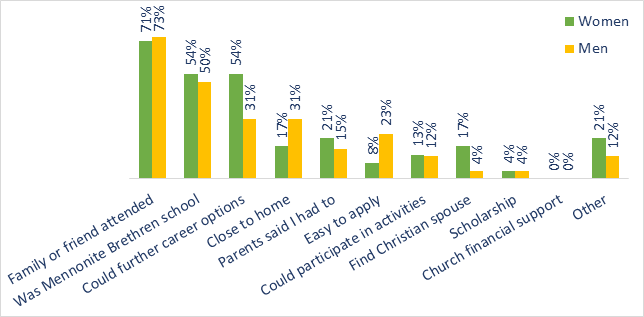
Having a family member or
knowing someone who attended was the most significant factor in choosing Tabor.
The college’s affiliation with the MB denomination was the second most
important reason. (Tabor College was the U.S. MB Church’s only four-year
college as we were completing high school in 1963.) The belief that they could
further their career options was also important. The latter, however, was more
important to the women than the men. Proximity to home and ease of applying
were more important to the men than the women.
When given the opportunity to
elaborate on their college choices, several mentioned having grandparents in
Kansas or having previously lived near Hillsboro so they were familiar with the
area. That helped direct them to Tabor. A number noted that there was never
really a question about where they would enroll. They (and usually their
parents) had always assumed they would attend Tabor.
As we will see later, a third of
our classmates did meet their spouses at Tabor. This includes all the
women who indicated that finding a Christian spouse was important.
Several classmates transferred
to Tabor during our junior year after a Christian college in Minnesota that they
had been attending closed. Tabor made it easy for them to enroll.
We noted earlier that many in our
class spent four years at Tabor and then graduated. Some attended more than one
college but graduated from Tabor. Others attended Tabor but graduated
elsewhere. Figure 3‑2 shows how much time the Class of ’67 spent at
Tabor.
Figure 3‑2 The amount of time we spent at Tabor.
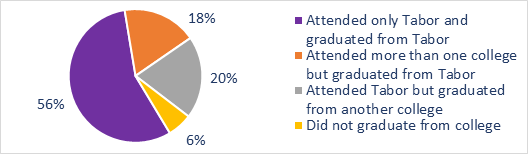
Three-quarters of the survey respondents ended up graduating
from Tabor, though some had previously attended other colleges. Twenty percent
attended Tabor but transferred out and graduated elsewhere. Several completed
three years of Tabor and then transferred to professional schools such as
dentistry and optometry where they completed their baccalaureate programs
concurrently.
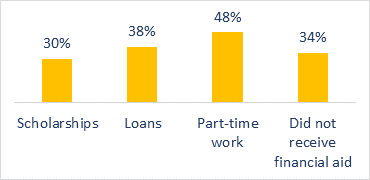
Paying for college today has
become a very significant issue for students and their families. College was a
lot less expensive when we were students. One-third of our class reported that
they did not have scholarships or loans, and were not working part-time during
college, as shown in the following graphic:
Figure 3‑3 Types of financial aid that we
received.
Based on the personal budget
records of one of our classmates, we estimate that when the Class of ’67
were freshmen, Tabor’s tuition for one year cost less than $1,000. By
2021 Tabor’s annual tuition and fees had risen to $32,100. Based on an
online calculator,[1]
the increase in tuition between 1963 and today is three and one-half times the
rate of inflation. This increase is consistent with other higher education
institutions and not unique to Tabor.
In the mid-60s, some students
earned enough on summer harvest crews or other jobs to pay for their entire tuition,
room, board, and fees. That would be virtually impossible today. The National
Defense Student Loan (NDSL) program was signed into law in 1958 but expanded
significantly in the early 60s. This made government loans more plentiful.
Our data show how many of our
classmates took loans through Tabor but not how many families took out private
loans to send their students to college. Loans to families would not
necessarily have been obvious to students. Many of us came from farms that
relied on annual operating loans or lines of credit. Parents may have taken out
operating loans that were also used to cover college costs without students
knowing this had happened.
Though college has become
much more expensive since we were students at Tabor, federal and state
financial aid have become more available. According to the latest data
from the National Center for Education Statistics, in 2020-2021 every Tabor
student received an institutional grant or scholarship. Seventy-three percent
took out federal loans.
Based on our own experience and the
suggestions of others who reviewed the survey instrument, we identified a
list of those extracurricular activities being offered while we
were students. We asked respondents to note all of those in
which they participated at Tabor. The following figure shows the
percentage of men and women involved in each activity:
Figure 3‑4
Men's and women's participation in campus activities.
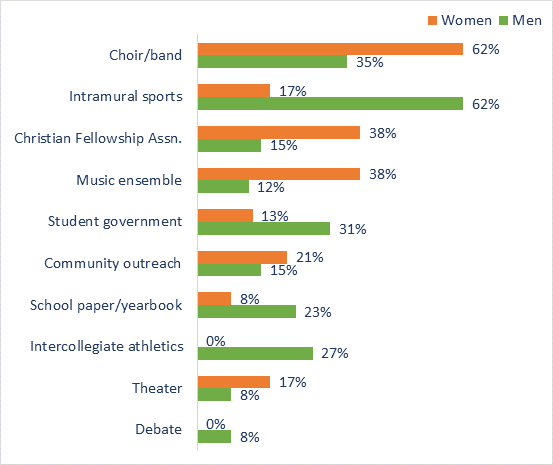
Music, intramural athletics, and
Christian Fellowship Association (CFA) were cited most frequently. A higher
percentage of women than men participated in choir/band, CFA, music ensemble,
and theater. More men participated in intramural sports, student government,
the student newspaper and yearbook, debate, and intercollegiate athletics. There
were no intercollegiate sports for women in small Kansas colleges prior to Title
IX, passed in 1972.
Tabor
was then, and still is, primarily a residential campus. The distribution for
our senior year is shown in Figure 3‑5.
Figure 3‑5 The type of housing in which we lived during our senior year of college.
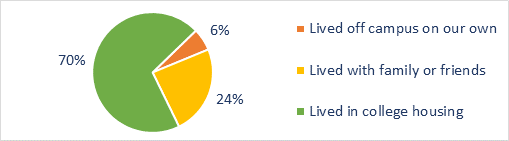
Most lived in campus housing
while a quarter lived at home, with family, or friends in the community. Several
(generally married couples) lived off campus on their own.
back to table of contents
People go to college expecting
to learn, grow, and change. We asked everyone to comment on how they had
changed at Tabor and the factors involved in that process.
The word
used most frequently to describe how the Tabor experience changed us was "broadening.”
One said, “[It] broadened my view, introducing me to people and ideas
that I had not considered before." Another responded, "I
discovered that there was not just a single correct answer to every question."
A classmate spoke to the broadening theme, saying "It excited and
challenged me to learn that there were so many interesting things to
investigate and consider and that asking questions was a good thing."
Looking back after more than a half-century, the limited
horizons we brought from our mostly rural, small-town childhoods clearly were
expanded at college. For example, one said, "Classmates and others
allowed me to see a broader slice of life and perspectives than I had growing
up in a small rural community." Another noted that college “Started
opening my eyes to a bigger world. It was my first step towards moving into my
own independent life. It also protected me from getting lost on a large
university." In a comparable note, still another suggested that Tabor "gave
me protection because it was small enough for me to adjust to life and not get
lost in the system of life."
Getting acquainted with a wider
range of people was another important part of that "broadening"
experience. As one classmate put it: "I made friends from so many
different places and I began feeling part of the world community." Another
spoke about living in the residence halls: "Dorm living and being
involved with people on a bigger level than my limited exposure of my early
days, really stretched me socially and intellectually." A comment that
reflected what many expressed was, "I developed life-long friendships
through the college although we have become very diversified politically."
Speaking of life-long friends, several emphasized having met their spouses at
Tabor!
Maturing in Christian faith was
another common theme running through what people wrote. As one put it: "[I|
began to think for myself instead of just parroting my parents' beliefs."
Another noted that the Tabor experience "Gave me a deeper understanding
of the faith that I had brought from home and Sunday School and helped shape my
own faith." A classmate said: "[At Tabor] I learned about
Christian service and living a life of humility and service to others."
Some indicated that Tabor
prepared them for specific professions or changed or sharpened their career
focus. The clearest and most common theme running through our
classmates’ comments was that Tabor opened their minds and broadened
their worldviews.
Given
the importance of teaching and mentoring at Tabor, we asked everyone to
identify the person (a professor, staff member, or coach) who influenced them
or was particularly helpful. We followed up by asking what it was about that
person which made the difference in the student’s life.
Respondents listed more than 20
different faculty members or coaches who had been particularly significant in
their lives. Sol Loewen (biology), Delbert Wiens (philosophy), Clarence Hiebert
(Bible and theology), and Clarence Harms (biology) appeared most frequently.
Others named by more than one student were Bill Johnson (chemistry), Roy Just
(sociology and the college president), David Karber (business), Emil Thiessen
(business), Paul Wohlgemuth (choral director), Leonard J Franz (history), Steve
Kimery (coach), Malinda Penner Nickel (English), Vernon Wiebe (dean of students),
and Marvin Kroeker (history).
A classmate wrote: “Delbert
Wiens challenged me to think, to apply my faith, and taught me the principles
of good writing.” Another wrote: “Dr. Paul
Wohlgemuth’s character and Christian testimony through music and example
of serving in the church influenced me.” Someone said: “Dr.
Sol Loewen believed in me and promoted me to leadership beyond what I thought I
could do.” Another said: “Clarence Hiebert provided a
broadened spiritual world view and encouraged me to consider overseas service
in Congo.” Another noted: “Dr. [Bill] Johnson [whose]
enthusiasm and love of chemistry and teaching put a smiley face on the cover of
the chemistry texts I would see during the rest of my education.” A
classmate said: “Ken Kornelsen gave me confidence in myself by telling
me I could succeed in college… [He] believed in me when I didn't believe
in myself.”
Only ten classmates did not
identify someone as having been particularly helpful to them or influential in
their lives.
People’s comments revealed
how highly they valued those who took a personal interest in them or reflected
personal qualities they subsequently tried to model. It was not necessarily the
exceptional teaching in the classroom that made these professors special.
It’s significant that 80% of the respondents could point to a professor
(or professors) who had a specific impact on their lives. This personal
connection was a very important part of our class' collective experience and
suggests that this may have been Tabor’s strongest comparative advantage
over larger and better- resourced institutions.
We asked the Class of ’67 about their theological
perspectives at three different points in time: when they arrived at Tabor,
when they left Tabor, and today. We gave them a five-point scale that went from
Very Conservative to Very Liberal. Figure
4‑1 shows how we changed during
college.
Figure
4‑1 Our theological perspectives on entering and leaving Tabor.
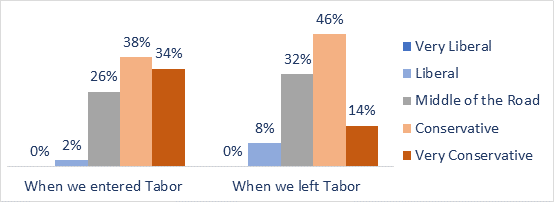
Nearly three-quarters of the
class described themselves theologically as having been either Conservative or Very
Conservative when they arrived at Tabor. Two percent described
themselves as Liberal when they arrived at
college. None described themselves as Very Liberal.
The proportion of the respondents considering themselves conservative or very
conservative dropped to 60% by the time we left Tabor. The Middle-of-the-road group grew as did the
percentage of those who saw themselves as Liberal
when they left Tabor. Again, none described themselves as Very Liberal at that point.
About 40% of our classmates,
using different words, said their theological beliefs had not changed or had
changed very little during their time at Tabor. For those whose theological
perspectives had shifted during college, we gave the opportunity to explain how
this happened, and why.
Among the majority who reported
that their theological perspectives had changed during college, some expressed it
as a deepening faith and moving beyond the “thou-shalt-nots” of
their youth. One described [Going] “… from legalism to
understanding true Christianity." Another: "My commitment to
Christ was reinforced and deepened." One put it this way: "I
became less legalistic and more desiring to live my life by loving Jesus and
wanting to serve Him." The same theme came out in another comment: "I
moved from a legalistic do’s-and-don’ts to an understanding of
Christianity established in the work of Christ."
The "broadening" theme
continued in several other comments: "[I] became more aware of
different perspectives which made me more open to other points of view."
Others expanded on that: "[I] realized that Christians come in all
shapes and sizes." One said: "I no longer believed that only
Mennonite Brethren would populate heaven." The
“broadening” theme came through in another statement: "I began
to understand that the Bible was more than a plug-and-play set of
instructions."
When asked what prompted these changes,
a number of classmates identified Clarence Hiebert's influence. For example: "Exposure
to new ideas, significantly through Clarence Hiebert's World Religions class,
which showed that the majority of the world was not consigned to hell."
Others mentioned the influence of Orlando Wiebe, Clarence Harms, and Delbert
Wiens in reshaping their theological perspectives. A number also noted how
discussions with friends and other students helped shape their new
understandings.
A later section will show how
our theological views have changed since college.
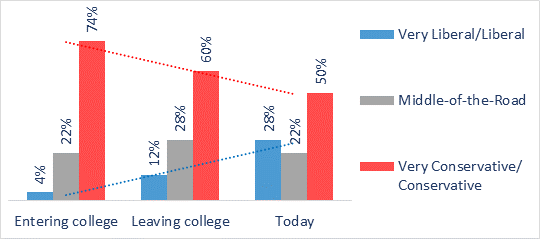
Not only did our theological
orientations shift, but so did the political perspectives of some of our
classmates. Again, we used a five-point scale from Very Liberal to Very
Conservative. Our changes in political perspectives while in college
(Figure 4-2) were less significant than our shifts in theological perspectives.
Figure
4‑2 Our political perspectives on entering and leaving Tabor.
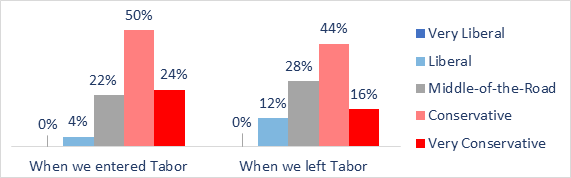
Three-fourths of our class
considered themselves politically Conservative or
Very conservative at the start of our
undergraduate careers. When we left Tabor, the percentage dropped to 60%. Later
in this report, we’ll see that it subsequently dropped further to 50%. Nobody
reported being very liberal either when
they started college or when they left Tabor. The percentage of the class who considered
themselves liberal increased from 4% when
they started college to 12% when they left Tabor.
The data show that our
classmates’ political views changed far less than their theological
views. We found that 70% indicated that their political perspectives did not
change at Tabor. They retained the conservative political orientations that
were formed while growing up in their home communities. We asked those whose political
perspectives had changed during their time at Tabor, what caused those changes?
Many said they had little political interest or awareness during college, as
typified by the following response: "I do not think I changed
politically during college—quite frankly I didn't think much about
it then. I always thought I would hold the same views as my father."
Another said, "I don't recall that political discussion was that much a
part of my experience although I was aware of what was happening in the world."
Of those who acknowledged that
their political perspectives had changed, most indicated they had become slightly
more liberal. The reason? Most in this group reported a growing concern about
the Vietnam War. None, however, hinted at any involvement in anti-war activism.
A few mentioned President Kennedy as an inspirational figure. One person
identified history and political science courses as having demonstrated that "progressive
political, social, and economic programs could make a necessary positive
impact." An individual whose views had not changed admitted that "I
became friends with people who had differing political views and became less
clear that I had the only acceptable perspective." Another classmate
said, "Actually my perspectives changed causing me to become more
conservative."
Clearly, for the Class of ‘67,
Tabor College was not a politically charged place.
back to table of contents
Life
following departure from Tabor presented us with a new set of circumstances. Many
fulfilled their Selective Service obligations, went to graduate school, started
families, or began careers. Many of us lived in multiple states,
some lived abroad, and most traveled outside the country.
We came of age during the
Vietnam War and military conscription. Consequently, the men who were U.S.
citizens, and therefore subject to the draft, faced a choice on how to respond.
While some received deferments (educational, medical, etc.), the others had to
choose between alternative service or the military. Those choices are
summarized in Figure 5‑1:
Figure 5‑1 How the men in our class fulfilled their Selective Service requirements.
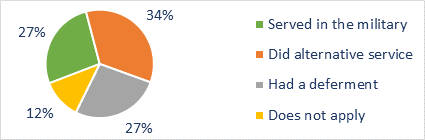
A third performed alternative
service as conscientious objectors. We will see later that many of the latter
served overseas in Africa with the Mennonite Brethren Missions/Services (now called
Multiply) or the Mennonite Central Committee. This was largely attributable to
the active encouragement of Tabor faculty.
We wanted to know the extent to which our class went on to
earn other degrees after graduating from college and looked at the data by
gender in Figure 5‑2. We collapsed academic (Ph.D.) and professional
doctorates (JD, DMIN, EdD, DDS, and OD) into a single category of doctorates.
Figure
5‑2 Our highest degrees, by gender.
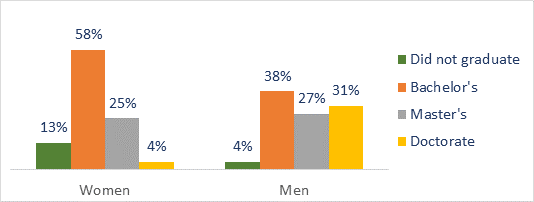
Forty-four
percent of our class went on to professional or graduate school. Similar
percentages of men and women received master's degrees as their highest degree.
However, an additional 31% of men received a doctorate degree, in comparison to
4% of women.
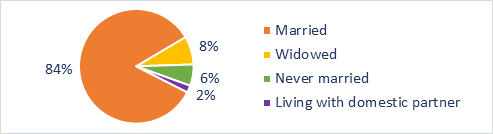
We asked respondents about their
current marital status. (We did not ask about divorce or remarriage.)
Overwhelmingly we are married today (see Figure 5‑3).
Figure 5‑3 Marital status today.
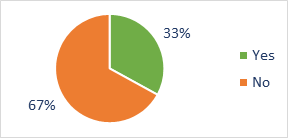
How many of our classmates met
their spouses at Tabor? A college like Tabor would have been considered a
particularly good place for young Mennonites to find a life partner. Of those
who married, one-third of us did.
Figure 5‑4 Meeting a spouse at Tabor.
Most of us (Figure
5‑5) had children or stepchildren.
Figure 5‑5 Percentage of the class with children
or stepchildren.
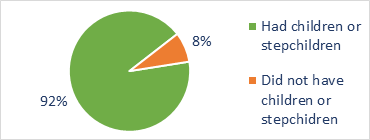
Although many of us were
parents, we will see later that few of our children went to Tabor.
back to table of contents
Americans
have generally become more mobile in recent decades so we asked our classmates about
where they had lived and traveled.
We noted earlier that more
than two-thirds of us came from farms and small rural communities.
Figure 6‑1 shows that
after college, many of us moved to urban centers.
Figure
6‑1 Type of place where we lived at age 16 and where we live today.
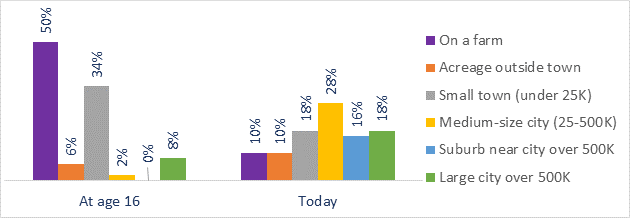
Today, 62% of us live in cities
with populations over 25,000. Just over one-third still live on farms or in
small rural communities like the ones from which we came. A third of us live in
large cities or suburbs.
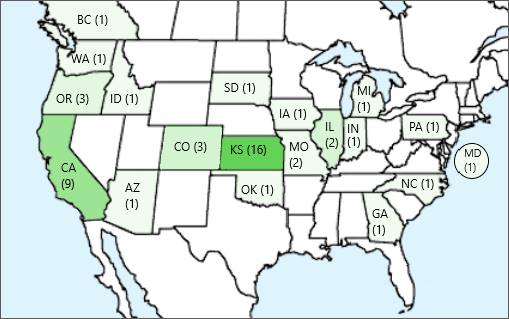
We also broke it down by state (Figure 6-2). As before college, Kansas remains
home to more of our classmates today than any other state, with California a
distant second.
Figure 6‑2 The states and province where we live today.
Our class has been mobile. As Figure
6-3 shows, the distribution of the regions in which we live changed markedly after
age 16.
Figure 6‑3 Regions where we live now compared to age 16.
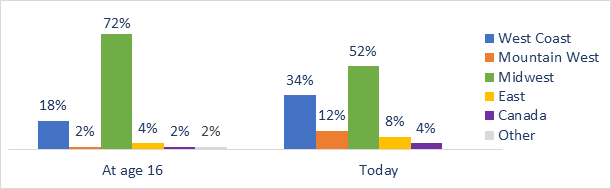
At age 16, nearly three-fourths
of us were living in the Midwest (between the Rockies and the Mississippi), a
figure that dropped to around half at the time of the survey. The percentage of
our classmates on the West Coast nearly doubled (increased from 18% to 34%)
between high school and today.
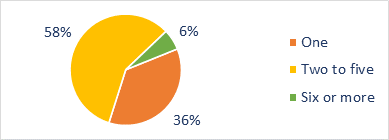
The majority of us (Figure 6-4)
lived in multiple states and provinces over the course of our adult lives.
Figure 6‑4 Number of different states or
provinces in which we lived.
About a third of our class (see Figure
6‑5) lived outside the U.S. or Canada at some point in their lives.
Figure 6‑5 The number of years lived outside the U.S. and Canada.
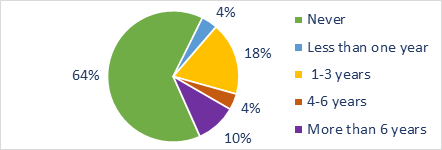
A number in our class fulfilled
their military or alternative service abroad, which helps account for the
number who lived internationally. Anecdotally, we know that those who lived
overseas for more than six years were serving with the Mennonite Central
Committee (MCC) or other NGOs.
Although Mexico is located in
North America and contiguous to the U.S., we included it as living or traveling
abroad since it would have been an intercultural experience. We did not consider
Canada as being abroad since the two countries share a common language,
culture, a permeable border, and often ties of kinship.
Because we were interested in our
classmates’ intercultural experiences, we asked them about their travels
outside the U.S. and Canada. We found (Figure 6-6) that many of us had
done so.
Figure 6‑6 The number of times we traveled outside
the U.S. and Canada.
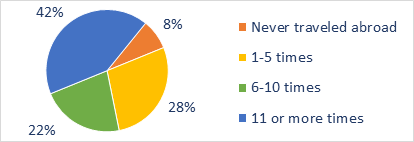
Again, this means that many of
our classmates had multiple opportunities to experience other countries and
cultures, though our data don’t show how many of these trips involved
cruises or vacations in the Caribbean.
back to table of contents
We were interested in our
classmates’ professional lives and careers after Tabor, so we asked them
what they did. We also asked them how they felt about their lives’ work.
Rather than try to create an
exhaustive list of potential careers in which our classmates had been involved,
we asked an open-ended question about their primary occupations. We then
clustered their responses into the occupational categories presented in Figure
7‑1:
Figure 7‑1 Our primary occupations.
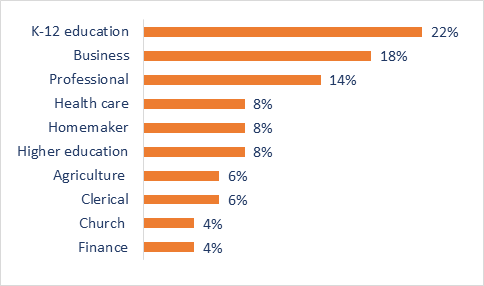
Education was the largest occupational field. Together, K-12
education and higher education employed nearly a third of our classmates. Business
and the professions were the next largest groups. Under business, we included
small business owners (photography studio, quilt shop, print shop, travel
agent, business products) and business managers. Professional included
accounting, journalism, fishery scientist, library science, and human resources.
Medical included medical research, nursing, dentistry, and optometry. Finance
included banking and financial services. The respondents in the church
category were pastors.
We were interested in the extent
to which people remained in the same field throughout their careers or switched
occupations at some point. Figure 7‑2 shows what we learned:
Figure 7‑2 Working in a single field versus changing to a different line of work?
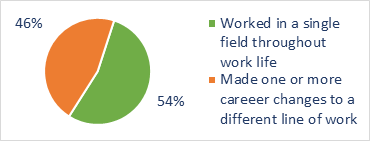
Slightly more than half of the
respondents indicated that they had spent their entire careers in a single
field while the others reported making one or more career changes. To be clear,
we specifically asked about career changes rather than job changes
since most people hold multiple positions over time, often with increasing
levels of responsibility.
Because we have lived through
periods of heightened unemployment during our adult lives, we asked about the
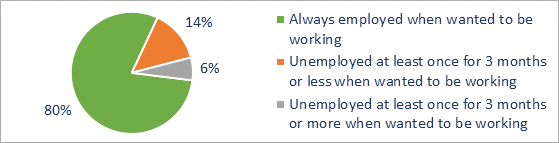
extent to which our classmates were employed when they wanted to be working. The
level of unemployment in our class (Figure 7-3) over the 50-year period was remarkably
low.
Figure 7‑3 Unemployment when we wanted to be working.
We then asked our classmates to
reflect on how they now see their lives and careers. Specifically, we asked
them to indicate how meaningful they found their work using a five-point scale
ranging from Lacked Meaning to Very meaningful.
Figure 7‑4 The extent to which we found meaning in our life's work.
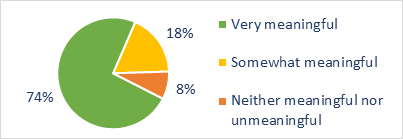
Ninety-two percent of our class
see their life’s work as Very meaningful
or Somewhat
meaningful. No one suggested they saw
their life’s work as having Lacked meaning.
Clearly, those in the Class of ’67 feel good about their life’s
work and careers.
When given the opportunity to
elaborate further, our classmates spoke almost in unison about what they meant
by “meaningful.” However, no one defined meaningful as “importance.”
Nor did anyone mention accomplishments, fame, or fortune. Was that because no
one climbed high up the corporate ladders or achieved enormous wealth? Or
because our parents, churches, home communities, and college education infused
us with a different definition of meaningfulness?
“Making a difference in
the lives of others”–whether students, customers, clients,
co-workers–was a common phrase people used to describe what made their work
meaningful. Several variations of the theme included: “I enjoyed
working with people and finding ways to make their lives more enjoyable and
meaningful.” Or “Teaching children to read [and] write, I
think was a very positive experience for me.” Or “People
should see God through you.” Or “I believe what I did made a
difference to my students and to the organizations in which I served.”
Several took satisfaction and
inspiration from meeting challenges. One said, “It was challenging,
served our customers often in social and emotional ways…it fed my
creative gifts.” Another said that “What I did from day to
day was intellectually challenging and satisfying.” One noted
satisfaction in that “I was always learning and continually facing new
challenges.”
Those who rated their work more
neutrally—neither meaningful nor unmeaningful—described it in more
guarded terms: “My occupation as a teacher was not particularly
meaningful. It was the way I earned a living. I was a good teacher, but not a
gifted teacher. It turned out well. I have no regrets.” Others said,
“Sometimes [my occupation] seems so vain, but it fulfilled a purpose for
my community.” One called it “…a job. Brought in income
and benefits.” Similarly, there was a comment that “[it] provided
for my family, and set my stage for retirement.”
back to table of contents
As Tabor graduates, we wanted to
know how closely, and in what ways, our classmates had stayed connected with
the college. Did they send their children to Tabor? Did they attend Tabor
events? Donate money? How do they feel about their Tabor experience five
decades later?
Although 92% of us had children,
few of them (Figure 8-1) followed us to Tabor.
Figure 8‑1 The percent whose children or stepchildren attended Tabor.
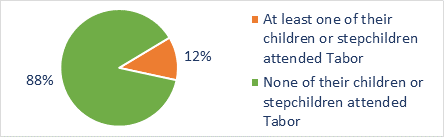
It would be interesting to explore
why so many who attended Tabor had a good experience and graduated there, but their
children went to other colleges.
We also asked about the ways in
which they have interacted with Tabor since graduation. We provided several
options (Figure 8‑2).
Figure 8‑2 Our interaction with Tabor since graduation.
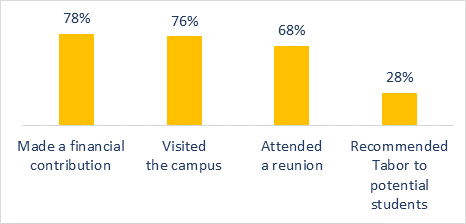
Our classmates are arguably
better connected with each other than are those in other classes. For example,
the class organized a 50-year reunion and followed it with a two-day retreat in
Hesston that brought together more than 35 people. In conjunction with the Golden
Graduate celebration at Tabor, the Class of '67 raised $30,000, which was a
record class gift.
Although not part of the
questionnaire, we are unaware of any of our classmates serving on the Tabor
faculty or the Board of Trustees.
While many contributed
financially to the college, our data show that only a quarter of the class had
recommended Tabor to a potential student.
In a 2021 Anabaptist World
editorial, someone wrote, “My education at [another Mennonite college]
was vital in laying a foundation for my life. Professionally and personally,
the ripple effects of my experiences in college are too many to count…I
would do it again.” Using a five-point scale from Strongly agree to Strongly
disagree, we asked our classmates about the extent they would agree with
that statement if it referred to Tabor College. Figure 8‑3 summarizes
their responses:
Figure 8‑3 "My education at Tabor was vital… I would do it again.”
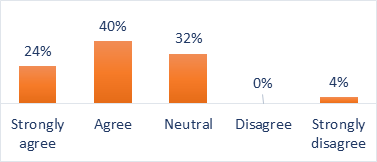
Nearly two-thirds agreed or
strongly agreed with that statement. Tabor had played a vital role in
establishing the foundation for the Class of ’67, and if we had to make
that decision over, we’d do it again. About one-third gave a neutral
response—neither particularly positive nor negative. Four percent
strongly disagreed with that statement. We asked everyone to share the
rationale behind their choice.
The responses, perhaps
influenced by how the question was framed, clearly said that Tabor provided “a
strong foundation,” “a good groundwork,” or
“a start for who I was to become.” A number indicated that
Tabor provided a transition from their small-town home communities. One noted, “Given
the limited exposure to the world I received prior to college, Tabor was an
appropriate next step for me.” Another said, “Tabor was a
place for me to understand the narrow scope of the MB world; before that I
thought that was all there was…the main benefit was it helped me to ask
questions.” Someone else described faith formation during college as “not
changing, but growing stronger,” and acknowledged “exploring
the elements of my Christian faith in a way that led to further growth and
understanding later.”
“Life-long
friendships” and meeting a spouse were mentioned by more than a few
as lasting benefits from their years at Tabor.
Some hinted that their academic
training at Tabor was good, but not great. Others praised the academic
preparation for their careers. Several responses mirrored the comment of one
who “found a field of study/work that was the first step toward a
satisfying career.” Similarly, some echoed their response to an
earlier question about a professor who made a life-changing difference by
pointing them in the direction of a career they had not previously considered. Others
reported gaining confidence in themselves, something they had previously
lacked.
Those who were neutral about
Tabor—neither agreeing or not with the statement—said or implied
that they had been shaped more by their previous experience and relationships (e.g.,
“parents and grandparents”) or after (“situations
and experiences after college life”). Some acknowledged that they had
been too immature during their college years to receive the full benefit of
what college had to offer.
Looking back, another noted that
“While I had a great experience, I doubt I would pay today’s
tuition [to attend Tabor].”
back to table of contents
We asked our classmates about
their theological beliefs—and how these had changed over the decades. We
also asked them about their participation in religious activities.
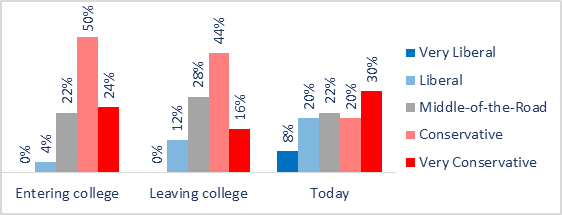
Our data show that we moved toward the two ends of the
theological spectrum. Some became more liberal while others became more
conservative. We were definitely conservative when we arrived at Tabor, but by
the time we left, we were less so. We generally are even less conservative today
as we can see in Figure 9‑1.
Figure
9‑1 Our theological perspectives entering Tabor, leaving Tabor, and
today.
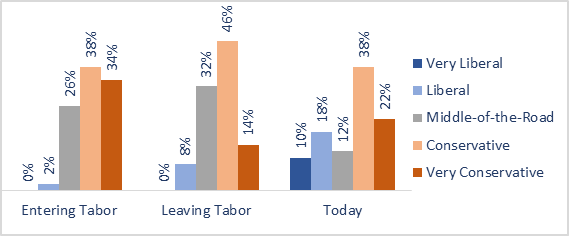
The relative size of the Conservative/Very
Conservative group is the same as it was when we left Tabor, but today, more
of those describe themselves as Very Conservative.
Over the same period, the Liberal/Very Liberal group grew to more than a quarter
of the class. Since we left Tabor, we have moved theologically from the center
toward the two ends of the spectrum, with some becoming more liberal and the
conservatives becoming more conservative.
Given the opportunity to comment
on how their theological perspectives changed since their college years,
classmates who identified themselves as liberals were more inclined to explain
what shaped them. One went so far as to say, “Christianity/spirituality
have been completely left behind, because of the way human beings call
themselves Christians, but don’t live the way they say they
believe.” Others who retain their faith but see it differently than
they once did, spoke of taking the Bible “seriously, but not
literally,” or understanding it to be “metaphorical and not
literal.”
Of those whose views became more
liberal, most attributed the change to relationships with “people from
other religions or faiths” or “a diverse community of
friends and neighbors.” One said that “my children have
stretched my thinking.” More than a few pointed to international
experience, and specifically to teaching and service assignments under MB and
MCC programs; one described their service as having “tremendously
expanded my perspective on who and what Jesus was sent to
‘save.’” Another questioned “the idea that
Christianity is for all. The essence of humanity is kindness, goodness, respect,
and is something that can be found in Buddhists and Muslims, too.”
Those who described themselves
as theologically conservative were less inclined to offer explanatory comments.
Two expressed a similar belief that their Savior or God’s Word “remains
the same yesterday, today, and forever.” One said that “as I
have matured as a Christian, I have become more conservative and biblically
founded.” Others described spiritual changes that didn’t alter
fundamental beliefs, but reported having matured, grown in knowledge of Christ,
and “moved from legalism to grace.” One elaborated by saying
“I am more compassionate and accepting to diverse thinking and
opinions, while not abandoning my core beliefs and values. I am not
confrontational now and more accept[ing] of questioning than I was when I was a
senior at Tabor.”
How we view Jesus
We used two questions to learn
more about the underlying assumptions people make about Jesus and the Bible.
A fundamental difference between
Christianity and other religions is how they view Jesus. We gave the
respondents several statements that reflect different views and asked them to
identify the one that most closely aligns with their beliefs. See Figure
9‑2:
Figure
9‑2 Our views of Jesus.
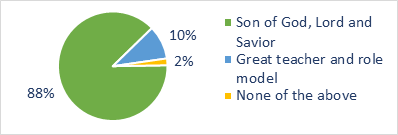
Most of
the Class of ’67 continue to reflect a very evangelical Christian view of
Jesus and his ministry—seeing him as Son
of God, Lord, and Savior. We gave respondents another option: that Jesus
was Simply a prophet and teacher like others of
his time, though better known. None selected it. A national survey in
2020 by LifeWay Research, on the other hand, found that 51% of the people
agreed (or strongly agreed) with the statement saying that Jesus was a great
teacher, but not God. Thirty-six percent disagreed while 12% said they were not
sure.[2]
A 2022 Gallup poll found that the number of people in the
U.S. who believe in God has now dropped to 81%.[3]
As the LifeWay Research study found, however, they just don’t believe
that Jesus is Lord. The Class of ’67 does.
How we view the Bible
We followed up with a question
about people’s views of the Bible. We asked them to choose a statement
from several options that best described how they see the Bible today. The
responses shown in Figure 9‑3 reflect a conservative view of the Bible.
Figure 9‑3 Our views of the Bible.
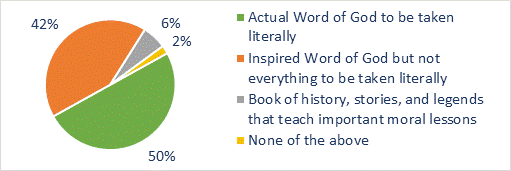
The respondents generally held a
conservative view of the Bible but reflected the divisions among many
Christians. Half see the Bible as the Actual Word
of God to be taken literally, word for word. Forty-two percent believe
it is the Inspired Word of God, but not
everything to be taken literally. A few see it as a Book of history, stories, and legends that teach
important moral lessons. As a point of comparison, a recent poll of U.S.
adults found that 20% see the Bible as the “actual word of God.”[4] Forty-nine percent believe it is the
“Inspired word of God” but not necessary the “actual
word of God,” while 29% consider the Bible to be “an ancient
book of fables.”
The data show that
people’s political orientations are reflected in how they view the
Bible. Eighty percent of those in the politically conservative or very
conservative group indicated they see the Bible as The actual Word of God to be taken literally. Twenty
percent of them see the Bible as the Inspired
Word of God but not everything is to be taken literally. Seventy-five
percent of those whose politics place them in the Middle-of-the-road, Liberal, or Very
liberal groups see the Bible as the Inspired
Word of God but not everything is to be taken literally. Five
percent of the politically liberal and middle-of-the-road referred to the Bible
as the Actual World of God to be taken literally,
word for word. Twenty percent of this group called the Bible a book of
history, stories, and legends that teach important moral lessons.
Church attendance might be
considered one objective indicator of religious commitment, so we asked how
often they attended religious services. Because this survey was conducted
during the pandemic when many churches were meeting online only, we asked respondents
how often they attended religious services prior to the pandemic. Figure
9‑4 shows the results:
Figure 9‑4 Attendance at religious services before the pandemic.
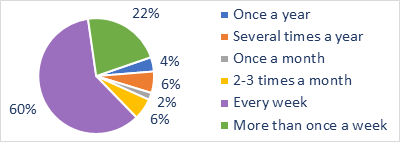
A total of 88% indicated that they attended church services
at least two-three times per month. Only 10% said they attended less than once
per month. Although Did not attend religious
services was given as an option, no one selected it.
According to research by the Pew Research Center, 24% of all
Americans attend religious services at least once a week but for adults 65 and
over, that increases to 48%. Sixty-three percent of evangelicals attend weekly.[5] Clearly, the Class of ’67 has
continued to participate in religious services at over twice the rate of the
rest of the U.S. population or their age cohorts.
All respondents reported being
part of local churches when they finished high school, so we wanted to know if
this had changed over the years. Figure 9-5
indicates the types of churches of which they were part at the time of this
survey.
Figure 9‑5 Where we worship today.
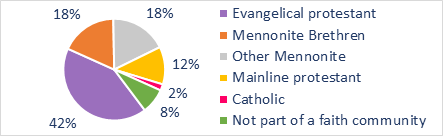
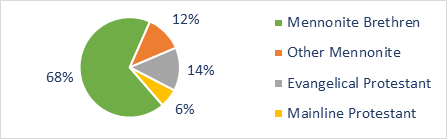
Though we were overwhelmingly
Mennonite when we came to Tabor, only 36% report worshiping with Mennonite
congregations today. Forty-two percent now say they are part of Evangelical
Protestant congregations.
The fact that 92% of the Class
of ’67 remain part of local congregations today is quite remarkable.
The following graphic shows how
the denominational affiliations of the Class of ’67 changed between 1963,
when most of us were finishing high school, and today:
Figure 9‑6 Change in denominational affiliations between high school and today.
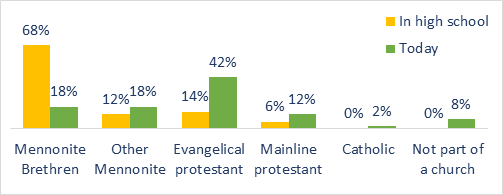
Eighty percent of us were part
of Mennonite churches when we started college. Today, that number has dropped
to 36%, evenly split between Mennonite Brethren
and Other Mennonite. The number of those
who now call themselves Evangelical
Protestant has tripled since 1963. The percentage of those who now
consider themselves Mainline
Protestants has doubled since we started college.
Finding significant movement of
MBs to other denominations, we wondered where they went. The distribution is
shown in Figure 9‑7.
Figure 9‑7 Where those raised MB attend today.
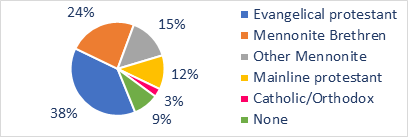
This graph shows where our
classmates who identified themselves as MBs at the start of college ended up. The
destination for MBs was mostly Evangelical
Protestant. It might be argued that today
there is little distinction between Mennonite
Brethren and Evangelical Protestant.
For those who continued to be
part of local congregations, we asked how they had been involved in their
churches. Specifically, we created a list of leadership roles and volunteer
opportunities in church and asked everyone to identify the ways in which they
had served their congregations over the past 15 years. We compiled the results
into Figure 9-8:
Figure 9‑8 Participation in the leadership of our congregations.
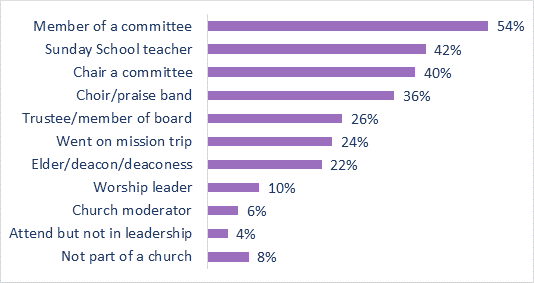
Clearly, the church has
continued to be central in the lives of most in our class. Having attended a
Christian college and having remained active in local congregations, it’s
not surprising that they also assumed institutional leadership roles.
When we broke down leadership
roles and voluntary service by gender (Figure 9-9), an additional story
emerged. Men and women hold dramatically
different roles in their congregations.
Figure 9‑9 Participation in leadership of our congregations by gender.
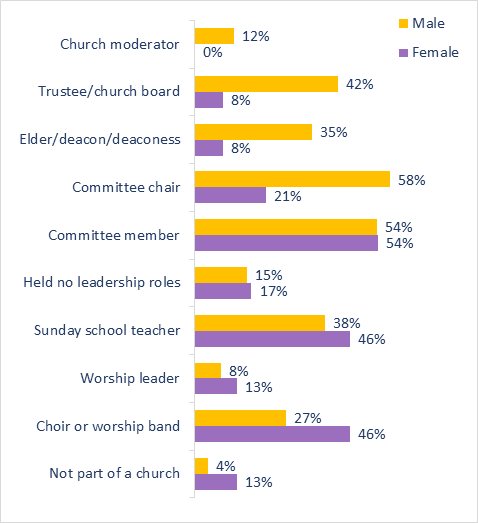
Women and men were equally
likely to have served on committees, but men were more likely to have chaired them.
Only men had been moderator, and few women served as a trustee or elder/deacon.
The data show that the men in our class have held more
leadership roles in our churches than the women. Likely this is because so many
in our class are now part of evangelical congregations where leadership is
assumed to be the purview of men. It certainly reflects the traditional gender roles
in the MB churches of our youth.
There are many issues straining
the church today. We created a list of issues from our observations and asked
respondents to identify how significant those issues are using a five-point
scale from Not Significant to Very Significant. The question focused on what
they saw as the issues straining the church, writ large, not the
importance or how they personally felt about those issues.
Figure 9‑10 The most significant issues
straining the faith community today.
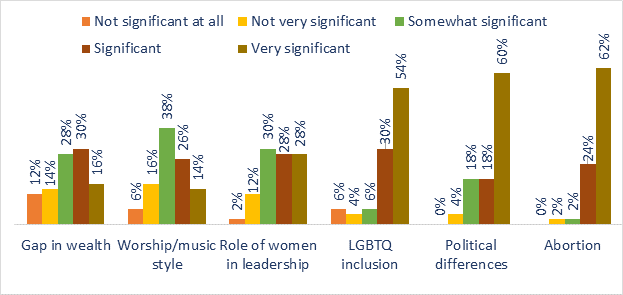
The hot-button issues are clear:
abortion, political differences, and the inclusion of LGBTQ congregants in
church. (Note that these results pre-date the June 2022 Supreme Court decision
on abortion.) The role of women in leadership causes less strain than these
three but is more important than differences in worship/music styles and gaps
in personal wealth.
back to table of contents
With politics emerging as a
significant issue in society, we asked our respondents about their political
perspectives and their involvement in the political process.
As we did with theological
perspectives, we asked our classmates about political perspectives: when we arrived
at Tabor, when we left Tabor, and today. The following graphic shows what we
heard:
Figure 10‑1 Political perspectives entering
Tabor, leaving Tabor, and today.
Entering college, very few considered themselves politically
Liberal; none said they were Very Liberal. However, by the time
we left college, those calling themselves Liberal
had tripled. The percentage of those who considered themselves Conservative decreased during college as did the
Very Conservative group.
The greater change—in both directions—took place
after college. The number who now call themselves liberal has more than
doubled. On the other side of the political spectrum, there was also a significant
shift, from Conservative to Very Conservative.
In order to visualize the trends, we reduced the
political spectrum from five points to three—collapsing Very liberal/Liberal into one
group and Very conservative/Conservative into
another in Figure 10‑2.
Figure 10‑2 Trends in our political perspectives.
This revealed a gradual, but significant, evolution in
our class’s political profile. The combined Liberal category tripled from
before college to after college. It subsequently more than doubled to
the present. The combined Conservative group dropped during our
college years, and since that time, it has decreased further to
today.
Based on this graphic, it’s clear that our
class has realigned itself into a new distribution across
the political spectrum.
With more to learn in these data, we will be exploring this
further.
We found something very
interesting when we asked people to comment on the change in their political
perspectives. Those identifying themselves as Liberal
or Middle-of-the-Road were more inclined
to discuss their change and the reasons for it, than those on the conservative
side of the spectrum. Those who had become more liberal attributed their new
perspectives to a greater awareness of poverty, injustice, and the inequitable
distribution of wealth. They identified reading, discussion, small-group
studies, and “more exposure to the world” as sources of that
awareness. As with the theological-perspective question, some referred to “working
overseas” and to “exposure to varied social, economic, and
cultural conditions during travel” as particularly formative.
Several characterized their
liberal tendencies as “Trying to be a Jesus follower in the real world,”
or similarly: “I have become more liberal and more socially minded. I
believe that Jesus was this kind of person who cared for the whole person.”
Two, who now position themselves
as middle-of-the-road, asserted, in the
words of one, “Donald Trump soured me on conservative [political] positions.”
The predominant theme among those
identifying themselves as politically conservative was that the nation had
drifted away from them. Another phrased the same idea another way: “Still
conservative. Somebody’s moved the middle.” And another: “As
I see the world around me getting more and more liberal, with all the hatred
and anger, I have moved to be more conservative.” One asserted that “I
became more conservative as I got older and the world got more liberal.” Another
lamented “watching the US drift from a constitutional republic toward
being a welfare state.”
We not only asked people about
their political beliefs—where they stood on a continuum from left to
right—but we also about their political involvement. We provided a list
of political actions and asked everyone to indicate the ones in which they had
participated. The compilation is shown in Figure 10‑3.
Figure 10‑3 Ways in which we have been engaged politically.
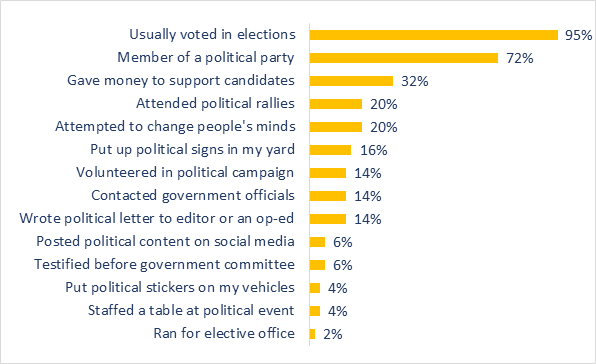
Although only one person among our respondents ever ran for
elective office, we know that two of our classmates, now deceased, had served
in their respective state legislatures.
Impressively, 95% usually voted, far
exceeding the national average. By comparison, in the 2020 U.S. election which
had the highest voter turnout in the 21st century, 67% of the
eligible voters actually voted; even among adults 65-74 and adults 75 and
older, the number was only 71%.[6]
Sources of national and international news
We know that people get their
news about the nation and the world from different sources. News sources tend
to have a perspective, so we asked our classmates to identify their three most
trusted sources for national and international news. The following graphic
shows what we learned:
Figure 10‑4 The types of sources of national and
international news that we trust.
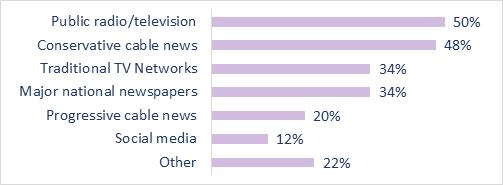
Like the country at large, our classmates have widely varied
preferences for the news sources they trust. Given the chance to identify three
different types of sources, no single type was favored by more than half of the
respondents. Two distinctly different types of sources—public
radio and television, and conservative cable news—were each trusted by
about half of the respondents. Traditional TV networks and major national
newspapers each were mentioned by about one in three; progressive cable news by
one in five; and social media by one in eight. Significantly, although we did
list not Christian radio as an option, 22% of the class wrote it in as one of
their three most trusted sources of news.
back to table of contents
We wanted to learn more about
our classmates’ engagement with civil society, the network of voluntary/non-governmental
organizations that are formed to address problems in their communities and the
world. We asked people to identify the types of voluntary organizations in
which they were involved. Since they had already responded to questions about
their participation in their local congregations, we asked about their
participation in non-church organizations as well.
As we noted earlier, 80% of our
class had Mennonite roots, so we asked how many of them had served with one of
the Mennonite service organizations. We presented a range of service
opportunities from those lasting a few days to a few years. Tabor actively
encouraged MB Christian Service overseas.
Thirty-eight percent of our class volunteered short-term with
at least one Mennonite social service organization. Figure 11‑1 shows the
percentages that served in each of the following organizations:
Figure
11‑1 Our service with Mennonite organizations.
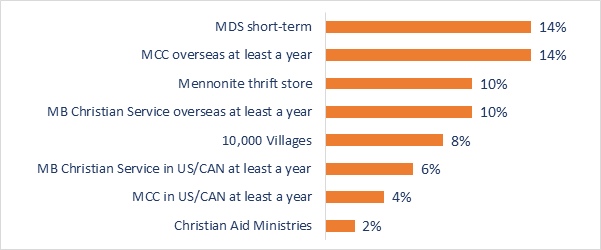
Twenty-four percent of our class
served at least a year with the Mennonite Central Committee and/or the
Mennonite Brethren Christian Service Program. Both MCC and MB Christian Service
assignments fulfilled the selective service requirements for men. Twenty-four
percent of our classmates volunteered with at least one short-term Mennonite
organization.
We were also interested in the extent to which our class was
involved in voluntarism outside their local congregations and outside Mennonite
service organizations. We listed the types of organizations with which people
typically volunteer and asked everyone to identify all the ones in which they had
been involved. Figure 11‑2 shows what we found:
Figure 11‑2 Our volunteer participation in
different types of organizations outside our local congregation.
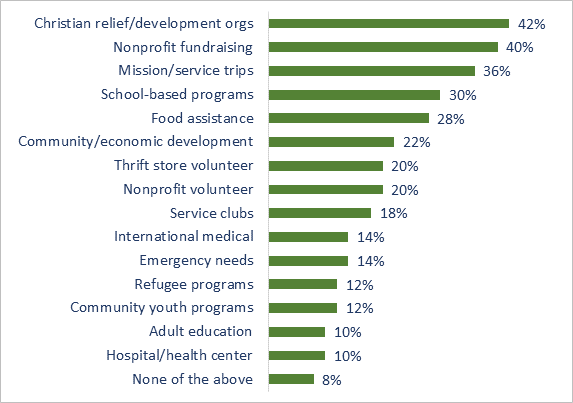
Ninety-two percent volunteered
with at least one of these types of organizations. Most identified multiple
organizations. Christian organizations involved in relief and development were
identified most often. We know anecdotally that people in our study have
volunteered with the Samaritan’s Purse “Shoe Box” program,
MCC relief sales, World Vision program activities, etc. The question about
mission/service trips specifically excluded mission trips sponsored by
people’s own churches. Thirty percent volunteered with school programs
and a similar number in food assistance programs such as Head Start and local
food banks.
While our classmates held
leadership roles in their churches, they were also serving with community and
other nonprofit organizations. They are actively engaged in of civil society.
Donating money is another element of voluntarism, so we asked
everyone to indicate which types of organizations they support financially. See
Figure 11‑3:
Figure 11‑3 Organizations through which we do
our charitable giving.
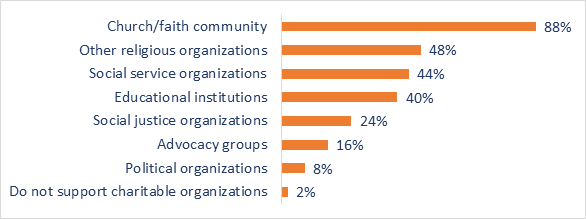
Most of our classmates give to
their churches/faith communities. Just under half support other religious
nonprofit organizations, social service organizations, and educational
institutions. Social justice organizations, advocacy groups, and political
groups are much lower priorities.
Our class is quite charitable when compared to the rest of
the American population. They not only support their churches but also other
nonprofit organizations and groups addressing the needs of society. A Gallup
Poll in 2020 found that 73% of Americans donated to charity during the previous
year, although that is a drop of 6% since 2009.[7]
We identified a list of leisure
time activities in which people like us are typically involved and then asked
everyone to select the three they value the most. Figure 11‑4 shows the
results:
Figure 11‑4 The top ways in which we spend our
free time.
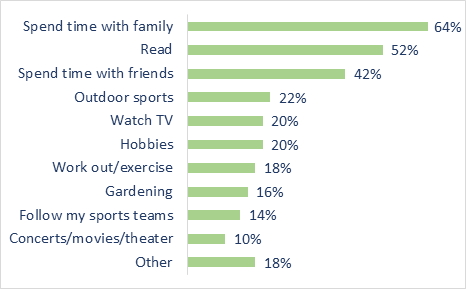
We enjoy spending our leisure
time with family, reading, and friends. We are social creatures. Two of the
three clearly favored leisure-time activities involved spending time with
family and friends. Beyond that, we enjoy a wide range of equally ranked
individual activities.
back to table of contents
We identified a list of issues facing the nation today.
Then we asked everyone to select the three issues they felt were the most
important. As a point of reference, all but one of those responding to our
survey currently live in the United States. The following figure shows what our
classmates see as their top three issues:
Figure 12‑1 What we see as the most important issues facing our nation.
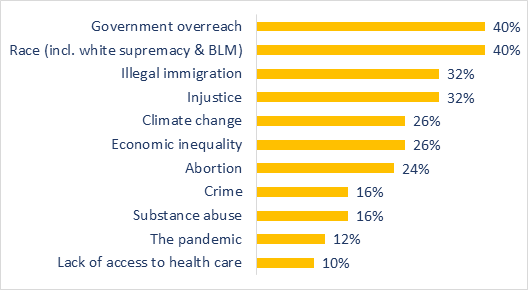
Government
overreach and Race were two of those
issues considered most significant. One third identified Illegal immigration and Injustice as critical issues.
We gave Other as an option and invited comment. Five of
the eight comments addressed spiritual issues: “spiritual ignorance,”
“postmodern acceptance of no absolutes for truth,” “the
church being ineffective,” and “failure in the spiritual
life of believers.”
We wondered if political differences accounted for what
people identified as the most critical issues facing the nation. We again
used the three-level, political scale we had created earlier (Liberal,
Middle-of-the-road, and Conservative). Figure 12-2 clearly shows that political
views matter when it comes to identifying what people see as the most important
issues facing the nation.
Figure 12‑2 Our political perspectives and the
most important issues facing the nation. (Each respondent could select up to
three.)
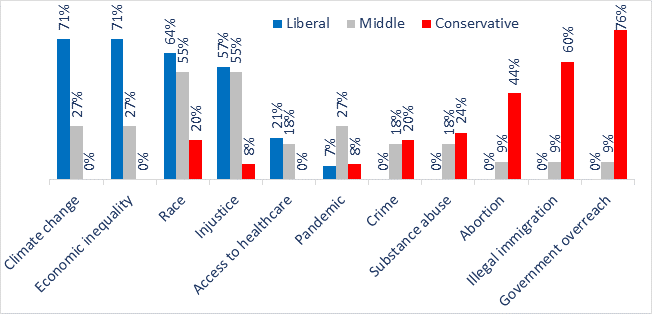
Political conservatives (the red
bars) identified Government Overreach, Illegal Immigration, and Abortion as the most important issues facing the
nation. None of the liberals did. (It is important to note that this survey carried
out well before the 2022 Supreme Court decision placed abortion front and
center in national discussions. Were this survey to be conducted later in 2022,
the responses would probably be quite different.)
Liberals (the blue bars)
identified Climate Change, Economic Inequality, Race, and Injustice
as primary issues. Only a few conservatives included Race or Injustice
as a top concern.
Those in the political center (the
gray bars) aligned themselves more closely with the liberals than the
conservatives, identifying Race and Injustice as significant issues followed by Climate change, Inequality,
and The pandemic.
We found no significant
differences between the views of men and women.
The most important finding here
is that we have two groups who almost completely disagree with each other about
the critical issues facing the nation. Liberals and moderates largely agreed on
their top issues. As a group, conservatives largely agreed among themselves on
a separate set of issues, with essentially no overlap with the rest of the
class. The only overlap was on Race but
it’s not clear from the data if they were concerned about it for the same
reasons.
This fundamental difference on
how we define the nation's most pressing problems clearly mirrors what we are
seeing in our nation today.
We asked everyone to look at a set of issues facing the
world today and to identify the three they considered the most important. (We note
that the survey was taken before the Russian build-up and attack on Ukraine.) Figure
12‑3 shows what we heard:
Figure
12‑3 The most important issues facing our world. (Each respondent
could select up to three.)
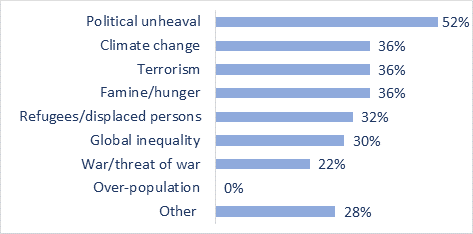
More than half identified Political upheaval as one of the top three
issues facing the world. Interestingly, no one identified Over-population, a major concern in the 1970s,
as a top concern today.
Most of the remaining options were
selected by between 22% and 36% of the class. We found little difference
between how men and women saw these issues. People’s differing political
views were reflected in what they identified as the most significant world
issues, but the differences were not as dramatic as we found when we asked
about national issues.
While the majority of our class did
identify three national and world issues, there was one notable exception. Most
of those who identified themselves as Very
Conservative used only half of their selections.
We included an Other category and gave people an opportunity to
propose something not on the list. One theme arose repeatedly: Ten of the 14 comments
identified the major problems facing the world in spiritual terms such as,
“world without Jesus,” “fear of God,” “exposure
to the Word of God,” “lack of God awareness,” and
“removal of Christianity from daily life.”
Given the differences in our
classmates’ theological views and differences in their political views,
we looked at how the two aligned on a scale from Very
Conservative to Very Liberal. Table
12‑1 compares the two:
Table 12‑1 The relationship between our
theological and political perspectives.
|
Political Perspectives
|
|
Liberal
|
Middle- of-the- Road
|
Conservative
|
|
Theological Perspectives
|
Conservative
|
2%
|
10%
|
48%
|
|
Middle-of-the-Road
|
|
10%
|
2%
|
|
Liberal
|
26%
|
2%
|
|
Twenty-six percent of the class
consider themselves Liberal
or Very Liberal in both
politics and theology. Ten percent identify themselves as Middle-of-the-road in both politics and
theology. Forty-eight percent are Conservative
or Very Conservative in both
politics and theology. This means that when we define ourselves on a spectrum
from liberal to conservative, for 84%, our politics and theology essentially
overlay. Only 16% of the class hold political and theological views that
don’t closely align.
We performed additional
statistical analyses on the strength of the relationship between theological
and political perspectives. We found that the correlation between the two became
stronger over time—from starting college, to completing college, to
now. Our political views and theological views align more closely over
time, and the number of outliers decreases. We will be exploring this further
in future studies.
back to table of contents
Life has its ups and downs,
challenges and rewards. We also wanted to know how people feel about their
lives when they look back. Social scientists sometimes frame this in terms of
satisfaction and happiness. Satisfaction is what people feel
when they look back at the trajectory of their lives. Happiness refers
to how things are going these days.
Figure 13‑1 shows what we
learned when we asked our classmates about how satisfied they are with their
lives.
Figure
13‑1 Satisfaction with life.
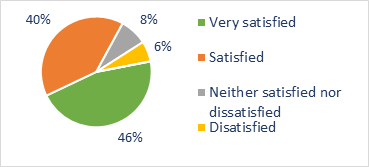
Eighty-six percent said that
they were Satisfied or Very Satisfied with their lives.
We asked our respondents to
reflect further. With everything taken together, we asked “how happy are
you these days?”
Figure
13‑2 Happiness in life.
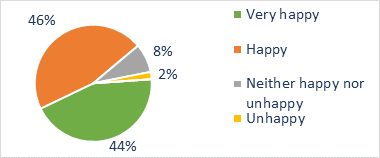
Ninety percent said they were Happy or Very Happy
these days; only one person selected Unhappy.
It is interesting to compare these reports of overall
happiness and satisfaction with Figure
7‑4 that measured people's assessment of the meaningfulness of their
careers. In all three cases the combination of classmates who found their
careers meaningful/very meaningful and
their assessments of their lives overall satisfied/very
satisfied and happy/very happy were
in the 85-92% range.
A Gallup poll in early 2022 found that Americans felt very
satisfied with their lives in spite of however they felt about things in the
US. Ninety-two percent of those who attend church services regularly are
satisfied with their lives, compared to 82% of those who attend services less
than monthly.[8]
Our classmates match up well with those church-goers.
When we asked these two questions, the results were nearly
identical. Almost everyone was satisfied with the way their lives had gone
overall and characterized themselves as happy at present.
In an earlier question we asked for people's assessment of
the meaningfulness of their careers. The results there, as reported in Figure
7‑4, were strikingly similar. In all three cases the combination of
classmates who found their careers meaningful/very meaningful and their
assessments of their lives overall satisfied/very satisfied and currently
happy/very happy were in the 85-92% range.
Clearly, these highly positive results should not be taken
as an indication that all was smooth sailing and free of crises for our
classmates. It would take another research project to understand how to account
for such uniformly favorable self-assessments. In any event, it appears that
for most, life has been good.
back to table of contents
Sixty years ago, those of us who
became the Tabor Class of ‘67 were anticipating our senior year of high
school during which we would complete our college applications and decide where
to enroll. This document reports the results of a survey of those of us who
chose Tabor. It examined the backgrounds from which we came and summarized our
personal reflections about our lives at three points in time over the past 60
years: when we arrived at Tabor, when we graduated (or left) Tabor, and today.
We mostly came from highly religious, rural communities;
only one in this study came from outside North America. All but a few lived on
farms or small towns and attended small high schools. Many came from families
where neither parent had graduated from high school. We were raised in
Mennonite Brethren (MB) churches and reflected the conservative theological and
political perspectives of these congregations.
We chose Tabor primarily because of the influence of those
around us. Tabor was an MB college, and we knew people who had attended there.
Our families and home communities believed education was important and
encouraged us to enroll in college. Though some of our parents had little
formal education, this was not a barrier to our own educational achievement.
Nor was coming from small high schools or families with limited financial
means.
Participants in our study referred to Tabor as a broadening
experience. It opened our minds and introduced us to new ideas, perspectives,
and people that extended far beyond the small communities in which we were
raised. Some indicated that Tabor prepared them for specific professions or
shaped their career choices in specific ways.
This was due not only to the classes we took and the extracurricular
activities in which we were involved, but also to the professors who taught and
mentored us. Most of us can identify a specific professor who had a lasting
influence on our lives. Comments emphasized an appreciation of faculty who took
a deep personal interest in individual students or modeled admirable qualities.
Though Tabor was generally a broadening experience for us,
the changes in our theological and political perspectives during college were
relatively modest. Given our starting points, most changes tended to make us
slightly less conservative, or slightly more liberal.
In addition to what we learned at Tabor and the changes in
our values and worldviews, we also formed lasting friendships. Around a third
of us met our spouses in college.
When we asked classmates to reflect on their decision to
attend Tabor, most indicated they "would do it again,” but very few
of our children followed us to Tabor.
Most of the men in our class faced the draft upon
graduation. One-quarter entered the military, while over a third opted for
alternative service as conscientious objectors.
Nearly half of our classmates went to professional or
graduate school. In striking contrast with our parents’ generation,
equal numbers of men and women earned master’s degrees as their highest
degree. However, many more men than women obtained a doctoral degree.
Our lives and careers differed substantially from those of
our parents. Ninety percent of us came from rural communities—farms and
small towns—but many now live in medium-to-large cities or suburbs. Most
of our families came from agricultural backgrounds, but we entered a wide range
of careers. Remarkably few of us were ever unemployed when we wanted to be
working. Nearly all of us reported finding meaning in our work.
We came from similar backgrounds and shared a common college
experience that helped to define our early theological and political
views. However, after college, our lives, locations, and careers took us
in new directions. Some became more liberal while others remained generally
conservative or subsequently became more conservative. Not surprisingly, the
study found a correlation between our theological and political views before
college, after college, and today: People who are conservative or liberal
in one tend to be conservative or liberal in the other. However, today that
correlation is much stronger as though the theological and the political now
define each other.
We have remained remarkably engaged with the organized
church, regardless of our theological perspectives. We attend church at over
twice the rate of the general population. Though no longer mostly MB, we are still
predominantly evangelical in our affiliations. We are active in our local
congregations, volunteer in church programs, contribute financially, and take
on leadership roles. Men and women are equally involved in church activities,
but the men tend to hold the primary leadership roles.
We are involved in our communities and politically engaged.
We vote at a much higher rate than the national average and serve as volunteers
in community organizations. The differences in our political orientations,
however, profoundly affect what we identify as the most important issues facing
the nation. The issues identified by those with generally liberal orientations
are not even on the list for those who consider themselves conservatives. The
opposite is also true.
We may be as polarized politically as the rest of our
nation, but these differences have not gotten in the way of our relationships.
In many ways, the responses to various questions in the survey revealed the
high value that our class has placed on relationships. Members of our class
have stayed in touch with each other over the decades through emails and
reunions. We followed our 50-year reunion with a two-day retreat that was
filled with cordial conversation, stories, and fellowship. It ended in a time
of worship and remembrance of our classmates who have passed on. It is
gratifying to report that tendency, and to be able to credit that warm
collegiality for making this study possible and successful.
back to table of contents
This research project grew out
of conversations among the four of us who graduated from Tabor College in 1967,
worked in Africa, went to graduate school, and then spent most of our careers
in higher education. Over the decades, we talked with each other and exchanged
emails. We reflected on our Tabor experience and noted the ways through which
it influenced the trajectory of our lives and professions. We also wondered how
our classmates viewed their college experience and how it impacted their lives
and careers.
We decided to ask them.
We drafted a concept paper that
laid out the study and shared it with Tabor President David Janzen and
Executive Vice President of Academics and Compliance Frank Johnson. They were
enthusiastic and encouraged us to move forward with this study. Dr. Johnson
wrote a letter of support and gave permission to process the survey through
Tabor College’s Institutional Review Board. We greatly appreciate
Tabor’s support.
Our classmates have stayed in
touch with each other to a remarkable degree. This has been facilitated by
class reunions, occasional emails, and two retreats—one ten years after
graduation and the other immediately after our 50-year reunion. They helped us
stay in touch and facilitated our study. We are deeply grateful to all who
participated!
There is a national debate over
the nature, purpose, and impact of a college education. Is it worth the time
and money? Do graduates value their college experience, years after graduation?
This led us to wonder how our classmates’ lives and careers had unfolded.
How did the Tabor experience shape them? Did their values, beliefs, and
commitments change over time? To what extent—and in what ways—were
our classmates involved in their churches, communities, and society itself? How
did their values influence their choices and priorities? These discussions
focused our study on the following questions:
·
How do our classmates perceive their college experience five
decades after graduation?
·
How did that experience help inform or shape their lives and
careers?
·
To what extent (and in what ways) did they become involved in
their churches, communities, and society itself?
·
What are their values, beliefs, and priorities today?
·
How did our classmates’ values, beliefs, and priorities
play out in their lives and experience?
Our questionnaire included
background data (gender, marital status, military/alternative service, where
they were raised, the types of high schools they attended, etc.). Other
questions focused on our classmates’ values, commitments, and levels of
engagement with the church, community organizations, and society itself. We
asked our classmates to reflect on how their theological and political
perspectives may have changed over time. Some of the specific questions came
from earlier research and the rest from our personal experience and interests.
We used Survey Monkey to
distribute the questionnaire, track responses, and summarize the data. We asked
several friends—social scientists—to critique the proposed
instrument and suggest changes. We incorporated their input and then pretested
it with a group of Tabor graduates from our era who were not in our class. Their
responses led to other changes.
After collecting the data, we
used descriptive statistics to summarize the initial findings that are included
here. However, we are continuing with more in-depth analyses that will look
more deeply into trends and assess the relationships between multiple
variables.
Our first major decision was
determining who should be considered part of our class. This was not
straightforward. Do we include only those who graduated in May 1967? What about
those who left after our freshmen year? What about those who transferred to
Tabor later? What about those who spent a couple years at Tabor and graduated
from another college? We decided to include everyone who graduated in the May
1967 commencement, regardless of how long they had been at Tabor. Graduation per
se, we decided, was not essential to what constituted our cohort’s shared
experience. We included those who started with us but graduated a year early or
a year later.
We ultimately defined the Class
of ‘67 as those who graduated in May, 1967, as well as those who spent
two or more overlapping years as part of our cohort. This meant including several
who received their diplomas in a different year, from another school, or who never
graduated at all.
We started with email lists from
our class reunions to contact people. The Tabor College Alumni Office shared
its lists. Our yearbooks helped us identify others who were with us for a time
between 1963 and 1967 but were not on our lists. We also did web searches and
used several “people finder” websites to track down some of our
classmates.
This process yielded 148 names.
We found that 26 of our classmates were deceased. We eliminated another 40
people who were part of the 1967 cohort for only one year and did not graduate
with us. This reduced the list to 82 eligible names. We were unable to find
active email accounts for seven people. This left us with 75 to whom we sent
the questionnaire. We subsequently learned that one person on our list had
passed away several months earlier.
Of the 74 living members of the
Tabor Class of ’67 to whom we sent the questionnaire, 50 completed them.
That’s a 68% rate of return, high by any standard for social science
research.
Colleges and universities in the
United States are as diverse as their students, so we need to be modest about
our conclusions. We cannot generalize to all Tabor alumni or graduates of other
institutions. This survey of the Tabor College Class of ’67 is an
exploratory study, a first step. We hope that our findings spark meaningful
conversations within Tabor and the Mennonite Brethren Church (the
college’s founding denomination) but also encourage other scholars to
continue this line of inquiry. We have, in fact, received expressions of
interest from scholars at several other institutions who want to draw on our
work for their own research.
back to table of contents
Merrill Ewert (merrill.ewert@gmail.com) earned an MA
in cultural anthropology and a PhD in adult education at the University of
Wisconsin-Madison. He worked in international development and taught at the
University of Maryland, Wheaton College (IL), and Cornell University, and then
served as President of Fresno Pacific University.
Dale Fast (dalefast@gmail.com) received his
PhD in biology from the University of Chicago. He spent his academic
career at Saint Xavier University teaching in the Department of Biological
Sciences and working in the University administration.
David Klaassen (david.klaassen@gmail.com)
received his MA in history from the University of Minnesota. He spent his
entire career as Archivist and Professor at the Social Welfare History
Archives, University of Minnesota-Twin Cities.
Kenneth Ratzlaff (KLRatzlaff@gmail.com) received his
PhD in chemistry from the University of Illinois. He was on the faculty at
Northern Illinois University before becoming Director of the Instrumentation
Design Laboratory at the University of Kansas. His research collaborations spanned
biology, chemistry, physics and more.
Thanks in part to encouragement from professors at Tabor,
all four of us spent two or more years in Africa shortly after graduation.
Three of us served in the Democratic Republic of Congo under Mennonite Brethren
Missions/Services and/or Mennonite Central Committee: Dale as a secondary
school teacher, Merrill in rural development, and David as an international
community school teacher. Ken was a secondary school teacher in Botswana with
MCC.
back to table of contents
For digital copies of this report or the questionnaire, or
to view this document formatted for hand-held devices, go to http://taos67.net/.
back to table of contents